How To Create Winning Sales Reports

- May 5, 2022
You’ve likely been in a meeting where the sales manager presents a sophisticated report. By the time the meeting is done, you don’t even remember a thing the sales manager was talking about.
At Myphoner, we know that the information you put in a sales report goes a long way in helping the company make major decisions. Plus, it enables you to oversee the success of your sales team and, consequently, the whole company.
So it’s critical that you create clear and concise sales reports that show the most crucial information to your audience.
But before we do that, let’s do some housekeeping first.
What Is A Sales Report?
A sales report is a summary that shows the insights of your sales over a specified period in your company.
The information in the report differs from company to company however generally the number of leads, sales volumes, have newly opened accounts, and revenue for the specified time.
It comes in handy as it provides valuable insights into sales predictions of forthcoming sales data and a deeper understanding of your customer motivations.
How are Sales Reports Vital For Businesses
The main idea of sales reports is to gather data and present it in an easy-to-understand manner. When done well, it may serve many functions such as:
Forecasting sales performance by investigating a company's progress explores opportunities for improvement.
All these are good reasons why each company should create sales reports. But there’s something most companies miss.
In an interview, Marta Segarra, the Sales Operation Director at ForceManager, breaks down the importance of sales reports better.
She says most businesses think sales reports are only crucial to the sales managers and the executive team. But there’s one important person most companies overlook - the individual sales representatives.
“I believe the importance of sales reports is sometimes lost when it comes to individual sales representatives.” Says Marta.
And that is true because sales representatives are the engine of the company. They can do a lot when given real-time reports about their performance.
For example, they can summarize and pinpoint the number of deals they have at each stage of the sales process. With the data, it’s easy to identify areas of potential improvement in-field performance.
Additionally, detailed sales reports help sales reps package their information into understandable, readable snippets that they can use to prepare for face-to-face meetings.
Type of Sales Report
Conversion Rate Report
Conversion rate is the percentage ratio of deals won to the ones you lost within a particular period. In the same vein, the conversion rate report is a comprehensive document showing the number of closed sales against lost ones.
It is a monthly, quarterly, or annual report to determine the percentage of sales your company won during the period in review. With this report, you can detect the factors responsible for the increase or decrease in sales and what to do to improve your sales growth.
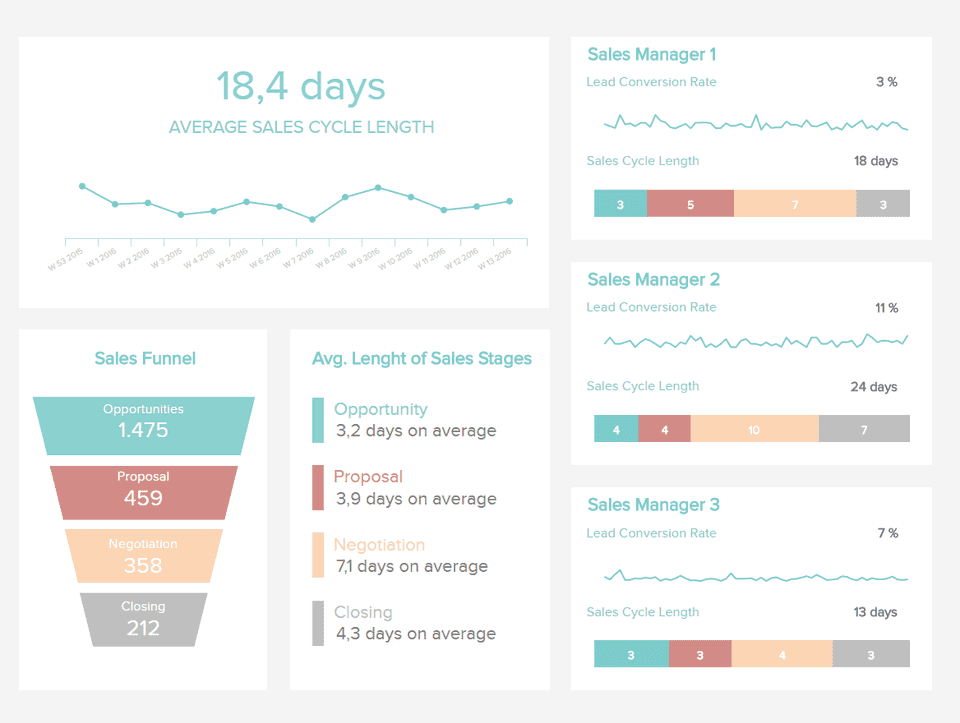
Average Sales Cycle length
This helps you understand how long it takes to start and close a sale. It equally hints at whether you should upgrade or retain your marketing approach and strategies.
Lost Rate By Sales Phase
This report provides accurate data about the number of deals your sales team lost during a specific phase of the sales cycle. It helps you figure out which phases to optimise and increase conversions.
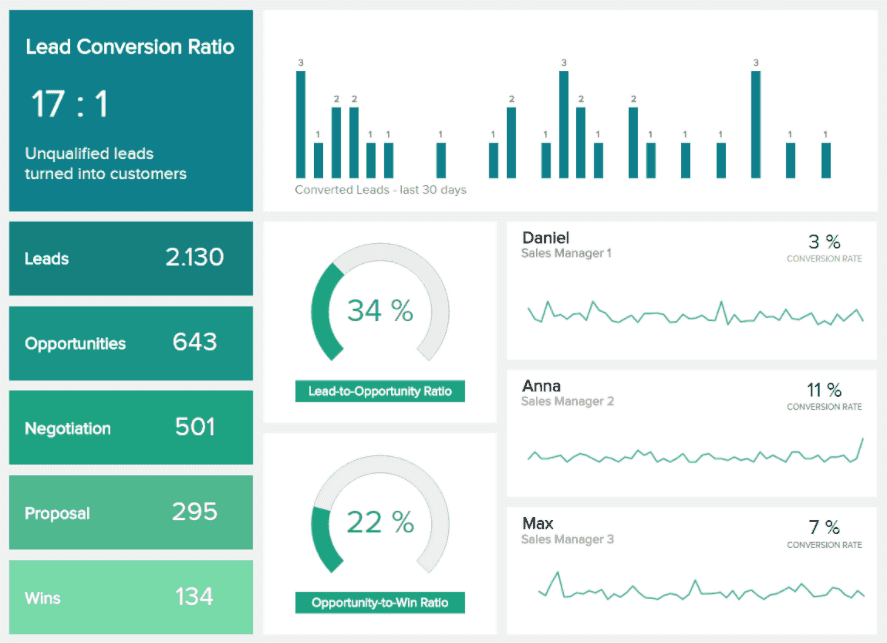
Campaign Activity Report
This report contains all the successes, failures, and important milestones achieved by your sales team. Unfortunately, making such a report can be stressful without the best software or technical know-how.
Hence, we advise you to explore Myphoner, one of the best software that provides a simple, and user-friendly interface for your campaign activity report.
With Myphoner, your campaign activity report will contain all you should know about your business, including a weekly progress chart (deals won or lost), conversion rates, and trends, as displayed in the image above.
Average Deal Size
It is a basic report which provides significant information on the average revenue obtained from every sale.
It is a monthly or annual report that allows you to keep close tabs on sales consistency and revenue generated.
You can set a new sales target to achieve within a specific period based on the data obtained via this report.
Marketing Collateral Usage
The marketing collateral usage report shows the list of marketing collateral used by the sales team while closing a deal and how often they utilize the resources.
It helps you know the most vital and helpful marketing resources based on how often your team uses them; thereby influencing your decision on which materials and resources to purchase.
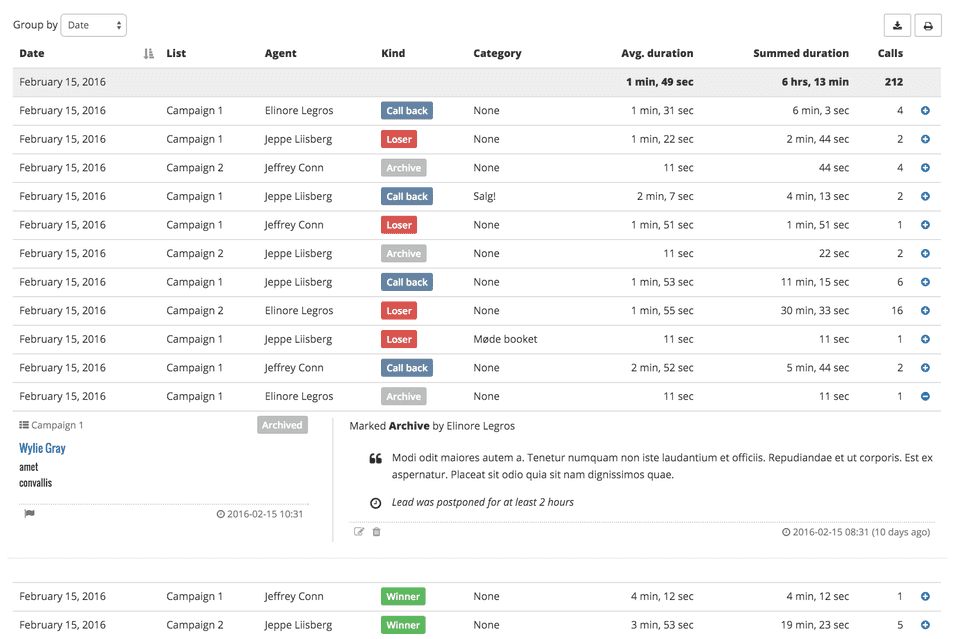
Sales Call Report
The sales calls report provides data and accurate information about the number of times a salesperson speaks to prospective clients within a particular period.
This report distinguishes proactive salespersons from ones who reluctantly perform their tasks.
You should provide this report on a weekly or monthly basis to determine the number of calls it takes to close a sale. Sales calls report also helps you determine which salesperson must improve their communication skills to increase their conversion rate.
Leeds Ageing
This report contains detailed information about your interaction with prospects, including the date and content of your last discussion.
It provides the information you need to know how a salesperson interacts with their prospects during a sales period.
Creating this report can help ensure regular follow-up until a prospect becomes a long-term customer.
Revenue By a Salesperson Report
This report provides all the details regarding the revenue generated by a salesperson within a specific period.
It is created every week or month, depending on the company's working policy or marketing strategy. It gives a clear indicator of the performance of a salesperson in the marketing field and his productivity when it comes to closing sales and converting leads into long-term customers.
Well-structured revenue by a salesperson report must include quotas, sales goals, percent contributed to the team revenue, the total number of sales closed, and the number of lost deals.
With this report, you can know each salesperson's productivity, prowess, and weak points. Therefore, it allows knowing the steps taken towards improving your sales growth and your business reputation in the long run.
Sales Opportunity Scores
This report involves scoring models or businesses with a high chance of becoming regular customers or business associates.
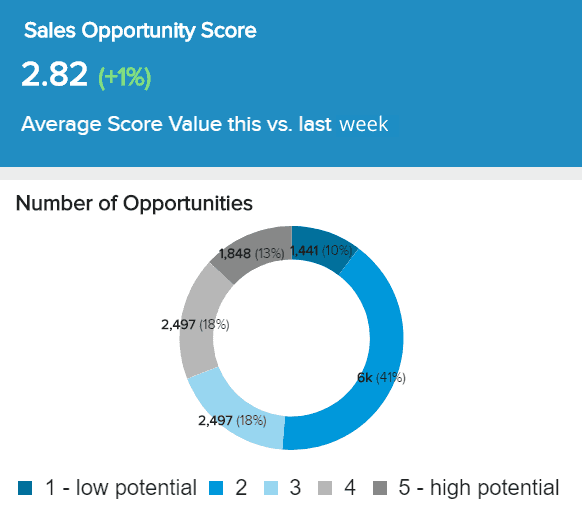
With this report, you can easily determine which prospect deserves top-notch attention considering the high odds of converting them into regular customers.
Upsell And Cross-sell Report
This is a weekly sales report template that helps you track the number of weekly transactions completed without any difficulty.
It gives you a clear understanding of your existing customer's behavior by disclosing the ones who love patronizing your business every week and the ones who prefer other competitors.
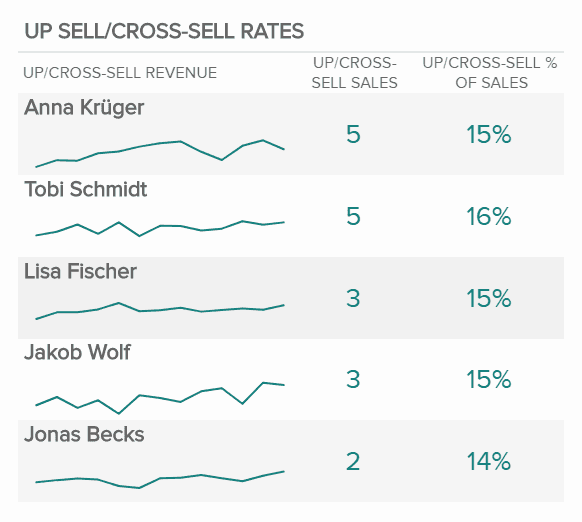
Likewise, this report helps you uncover the list of customers deserving improved loyalty packages and the ones you should strive hard to influence their purchasing attitude to your advantage.
How To Write a Winning Sales Report
As mentioned above, there are multiple types of sales reports. Most of them have a similar structure. They follow the same theme but provide different reports for different audiences.
Interestingly, multiple sales tools can help you create any of the above reports quickly. We’ll see how you can create one with Myphoner later.
Whichever sales reports you want to make, there are crucial elements you must have for each document. Of course, it depends on the report you want to make.
- Sales volume
- Net sales which is the number of sales in dollars
- Gross sales, which is net sales minus cost of sales
- Sales velocity (Sales Cycle Time)
- The percentage of KPIs change when compared to the last reporting period
With that said, here’s how you create winning sales reports that communicate the correct data and don’t put your bosses to sleep.
1. Understand Why You Need The Report
You can’t just create sales reports because every other company is doing it. There’s a general goal for each report, and that is to increase your overall profit margins.
While there are many steps before reaching that goal, the first thing to focus on is the reason why you’re creating the report in the first place.
Ask yourself the following questions.
Are you measuring your marketing campaigns? Do you want to compare the performance of your team members to bring some healthy competition? Or do you want to identify interesting trends in your sales?
Either way, knowing the purpose of your sales report takes you a notch higher. You’ll get to know the right data to collect and also determine the scope of your report.
2. Who Is Your Audience?
Sales managers create sales reports for different audiences.
For example, if the vice president of marketing is interested in the document, your report will show the marketing campaigns that bring more sales or how many leads turn to actual sales.
The finance department wants to know the sales team’s exact budget. They’d also like to know the current portion is enough. These are the sections you’ll focus on.
For your sales reps, they need a sales report that breaks down their individual leads acquired, loser ratio, and conversion rate.
And in the same light, the management team will be interested in a report that shows the company’s overall growth instead of the specifics.
For this reason, it’s important to create reports relevant to your audience. Your goal is to equip your audience with the suitable information that will help them make future decisions.
3. Collect Your Data
This is the most essential section since it significantly forms the basis of your sales report. Unfortunately, many businesses make mistakes here.
Research has it that 91% of companies use the wrong data in sales, leading to a 12% loss in revenue.
It calls for extreme accuracy to make sure you’ve got the right numbers. Ideally, what you’ll be checking is as follows.
- Lead time response
- Customers reached
- Deals won
- Deals lost
- Revenue generated
- Conversion rate
Of course, the data you gather also depends on the type of sales report you are creating. The best part? Many tools are available that can do the hard work for you.
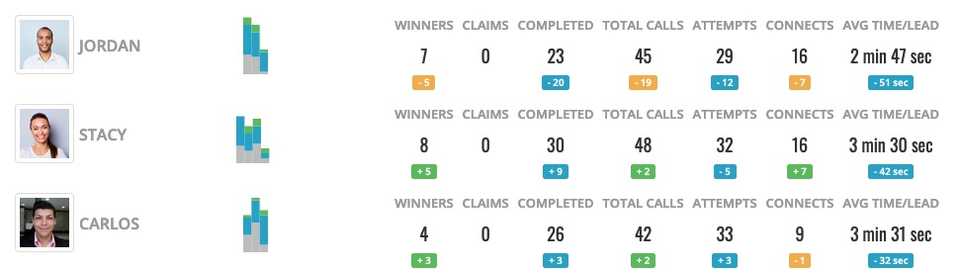
For example, Myphoner has a report section that allows you to configure agent reports by deciding which data you want to see.
This makes it easy to create real-time reports for each sales agent. See how it works. Whatever the case, you would also want to define the frequency for each report. Maybe you can settle on weekly, monthly, quarterly, or yearly cycles.
4. Compile and Double-Check Your Data
Once you have rounded up your data, it is time to compile them to get relevant information. Now, you’ve probably pulled your data from different places. The most common source is your CRM.
Once you’ve compiled everything, it’s time to analyze and interpret the data. But make sure you’ve got all your figures right for accurate reporting.
Don’t be afraid to take out unnecessary information. The goal is to keep your reports concise, clear, and relevant. You can also ask fellow sales team members to confirm that what you’ve got is correct and pertinent to your audience.
5. Use Visuals to Illustrate Your Data
A sales report isn’t a university thesis. Data visualization is its backbone. It doesn’t make sense to slap your audience with numbers and leave them stranded.
Visuals bring your sales report to life by making it easy to understand and digest.
In this regard, you’d want to use visuals like infographics, pie charts, line graphs, and bar graphs. Multiple tools can help you create these visuals, talk of Canva and Visem’s graph maker.
6. Interpret Your Data and Present
What you’ve been doing all along is to prepare for this section. Now, this step might differ depending on the type of your audience.
If you were preparing the report for your sales team, you just need to give them your reports and explain their performance status.
But if you’ll be presenting to the executive team, you must go a little bit deeper in your interpretation. All your preliminary findings must have a reason.
For example, if your monthly reports show a decline in sales during Covid-19, you can’t assume that your audience knows the pandemic is the cause.
While it plays a significant role, you’d want to go deeper. You can say that the leading cause was the wide shutdown of target companies after the pandemic hit the economy.
This approach doesn’t leave your audience hanging as you successfully justify the data you’ve presented.
7. Finish With an Action Plan
You’ve presented your sales report well. Everyone is happy. So what next?
The best reports are action-oriented, meaning they have a plan to ensure the company is still soaring.
For example, if covid-19 affected most of your sales, you would ask yourself the next plan to bring your sales back on track.
You might put on the report that you want to start a referral program as your new sales strategy. Ending your report with an action plan makes you credible before your bosses and your team accountable.
Conclusion
We can’t reiterate this enough; detailed reports go a long way in making decisions and propelling your sales team in the right decision.
However, it’s common to get dry and cluttered reports from sales teams. It doesn’t have to be that way for you too. You can still write informative reports while still keeping your audience engaged.
Sales performance reporting is a compulsory activity for every business owner who desires a sustainable and healthy advantage over competitors.
Hence, we advise you to lay much emphasis on your sales report as it can make or mar your business growth in the long run. Lucky for you, you have seven tips to help you get started.
Written by
Daniel Vincent
I'm Daniel! Head of Customer Success here at Myphoner. Over the past (almost) decade, I've worked with multi-national corporations as well as a handful of start-ups to transform their support experience into something truly exceptional.
At Myphoner, I spend most of my time trying to understand our client's experience and thinking of ways to improve it. My wish is for all our clients to be enabled to unleash the power of Myphoner within their businesses.
Related articles


Industry Related
An Agent is Never Better Than Their Contact Rate
Know when your telemarketing campaign is experiencing serious issues that prevent sales reps from having rich conversations with prospects.
January 10, 2023

Strategy
How to Outsource Your Telemarketing With Myphoner
Scaling faster while cutting costs by tapping into remote work represents an opportunity every business owner should explore, and Myphoner will help you manage the team.
December 4, 2022

Industry Related
How to set up an epic lead distribution system for your sales team
This post will help you understand how you can set up an effective system to distribute leads that’s fair, transparent, and simple enough for your entire sales team.
November 29, 2022